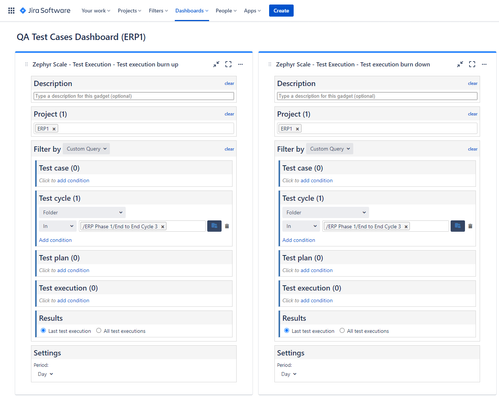
Burn Down Chart Dashboard gadget does not display accurate burn down
When building a Dashboard containing Burn Up and Burn Down charts using the SmartBear Zephyr Scale gadgets in Jira Cloud, the results displayed in the Burn Down chart are simply a mirror-image of the results displayed in the Burn Up chart, not accurately displaying the Execution Remaining results as expected. Configuration: Results: Using identical configuration specs, the Burn Up chart shows we tested 21 Test Executions (of 771 total) on June 09, 2021. The corresponding Burn Down chart does not represent that on June 09, 2021 we should have 750 Test Executions remaining. Is anyone else seeing these type of results from these gadgets? We are trying to build dashboards for management to be able to track real-time results, but the gadgets don't appear to calculate the data correctly.Solved2.5KViews1like3CommentsNew AlertSite UXM Grouping and Configurable Views
Hi, I'd like to share yesterday's AlertSite UXM Release Notes with you. We added some exciting new functionality around monitor groups, configurable views, and dashboards. I'll be hosting office hours this week to discuss these capabilities and will share the meeting info in a separate post. 05/26/2015 Release Notes Monitor Groups Monitors can now be grouped together based on any criteria you choose. Aggregate performance and availability will be shown for entire group. Group performance is calculated using the Apdex methodology, which allows monitors of different types and performance characteristics to be aggregated in a meaningful way. A new group summary screen is also being introduced. This screen will show the performance of the group by monitor, monitor type, and location. User configurable views Dashboards can now be modified using a variety of filters including Groups, monitor name, monitor type, and monitor status. You can create views which can be saved and recalled at any time. Individual users can set a default view, which will be the starting dashboard after login. Various bug fixes Thanks! Denis Goodwin Director of Product Management, AlertSite2.1KViews0likes0Commentsios and Android mobile application for SmartBear AlertSite
It would be of great value if we have a dedicated ios and android mobile app for SmartBear Alertsite Product which would then allow the end users to leverage the mobile app and visualize the data better rather than relying on the web page.2KViews7likes1CommentAlertSite Dashboard Update and Maintenance Notice
I’m writing to let you know about two important updates. This first is that there was an issue with AlertSite this morning from 5:08am to 6:49am EST. During this period, the AlertSite console and/or the primary dashboard may have been unavailable. Root cause of the problem was a database infrastructure issue. Additionally, we will be performing a critical upgrade to our database infrastructure on Sunday, January 24th starting at 7am EST. We anticipate this maintenance to take up to 2 hours, during which the AlertSite console may be unavailable. This maintenance is necessary to improve the resilience and performance of the AlertSite console. Please note that your monitors and alerts were not affected by this console issue and will not be affected by this Sunday’s maintenance activities. We apologize for any inconvenience.1.9KViews0likes0CommentsScheduling Manual Tests And Dashboard Chart Showing Progress Against Plan
A key metric I am commonly asked for is "what is our test progress against plan?" Right now, I have a custom field "planned test date" that I have to manually populate test by test (or fast edit). The only way I can report on this is to then run a test library export (from legacy reports as the new reports module .csv includes excessive blank columns) in to an MS Excel dashboard where I then have a formula similar to this: =COUNTIFS('QAC_Extract'![RANGE],[LOOKUP],'QAC_Extract'![RANGE],"<="&[TODAY]) (where LOOKUP is the Planned Test Date) Used in conjunction with total number of tests, and the sum of the tests that have a Last Run Status I can determine how many were planned by today and how many were attempted. This gives me stats as shown in the attachment. It would be great if QAComplete could do all this tracking for me, using a dashboard line chart.1.8KViews1like0CommentsAlertSite Maintenance Notice
Greetings, We will be performing necessary maintenance to the AlertSite platform tonight, February 2, 2016, between 10 pm and Midnight EST. During this time frame, you may experience sporadic slowness and/or downtime of the AlertSite console. Please note that your monitoring and alerting will not be affected by this work.1.8KViews0likes0CommentsProvide Direct URLs for Alertsite Views
In order to provide other teams with on demand shareable dashboards, I propose creating a dedicated URL for each view/dashboard that has been created. This would give our team the ability to quickly share different views dedicated for different audiences. For example, a view with monitor groups to determine the health of specific parts of our web applications.1.7KViews0likes2CommentsActive alerts on dashboard
on the dashboard, is there a way to highlight which monitors have active alerts? I don't care about errors, I want to see which monitors are in an active alert condition (maybe a sortable column). The errors screen is ok, but you have to read thru it. You can't quickly see the active alerts.1.5KViews0likes1Commentis there any Zephyr Gadget that support custom fields?
just checked the source that describes Gadgets of Zephyr: https://support.smartbear.com/zephyr-scale-cloud/docs/reports-and-analysis/using-gadgets.html is there any Zephyr Gadget that support custom fields? 2nd question where to see all the Gadgets?1.3KViews0likes3CommentsUpgrade the version of Chrome running on Selenium on Alertsite
As we have Angular web pages running version 6 and 7 that was released in 2018 they do not work on the version of Chrome that launches with Selenium on Alertsite. When you launch Chrome in alertsite it uses version 49 of Chrome which was released in 2016. Using Dejaclick Chrome launches in version 74. Suggestion. Upgrade the version of Chrome that Selenium launches in Alertsite to version 74 or greater. Thanks, Douglas McGonegle1.3KViews0likes1Comment

